

Forex Correlation: What’s Driving the Japanese Yen Market Right Now
Why the Japanese Yen Is the Centre of Attention Right Now If you trade forex intraday or forex swing setups, the Japanese yen is one of the most important currencies to watch right now. Not because of some dramatic headline, and not because the financial media has suddenly discovered a new reason to panic, which...
Disney Stock at a Major Demand Imbalance: A High-Probability Opportunity
There are moments in the market where everything just lines up. Not because of news, not because of hype, but because price has reached a level where institutions have previously made their move. Right now, The Walt Disney Company is sitting exactly at one of those moments. Disney has dropped into a major monthly demand...

Tesla Stock at Key Demand. Ready to move in Q2 2026
If you’re trying to learn to trade stocks and you’re still staring at earnings calendars like they hold the secrets of the universe, Tesla is about to teach you a very uncomfortable lesson. Tesla Inc. has just tapped into a fresh monthly demand level at $338, right in the middle of a long-term bullish trend....
Crypto Trading: Intraday vs Swing Trading Using Supply and Demand
If you’re trying to learn to trade crypto, you’ve probably asked yourself whether intraday trading or swing trading is better. It sounds like the right question, but it’s not. The real edge in cryptocurrency trading doesn’t come from choosing a style. It comes from understanding when each one makes sense based on supply and demand....
Swing Trading vs Intraday Trading in Stocks: The Truth Most Traders Ignore
If you want to learn to trade stocks, one of the first decisions you’ll face is whether to focus on intraday trading in stocks or move towards swing trading strategies. Most traders think this is a matter of personality or time availability, but the real difference runs much deeper than that. The truth is that...
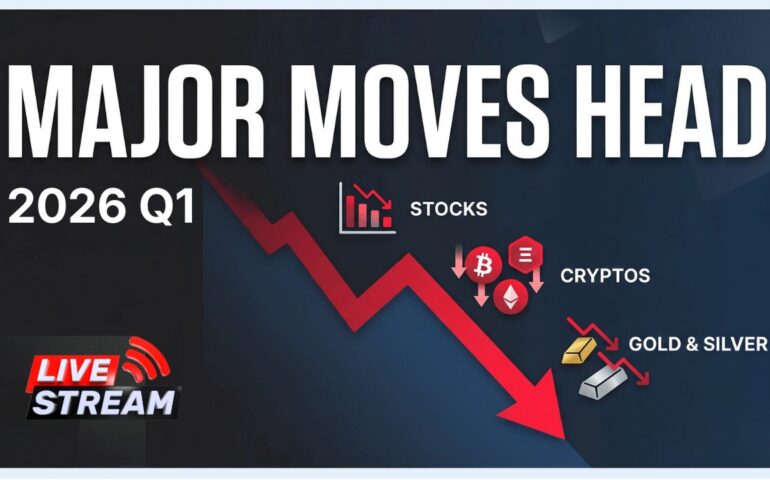
Why Stocks and Cryptos Are Dropping Hard in Early 2026
Let me say this clearly. If you’re buying the market right now… you might be doing exactly what most traders do right before a drop. Not because you’re wrong, but because you’re looking at the wrong things. Everyone is focused on news, geopolitics, inflation, interest rates… but that’s not what moves the market. That’s just...
Stop Buying Stocks at the Worst Time. How to Trade the Magnificent 7 Stocks in 2026 Using Supply and Demand
If you want to learn to trade stocks consistently in 2026, you need to stop reacting to price and start understanding where price is likely to react. Most retail traders focus on short-term candles, indicators, and news, but none of these actually explain why price moves. The reality is much simpler and far more powerful:...
Forex Market Analysis 2026: Major Moves Ahead Using Supply and Demand
The Forex market is setting up for major moves, but most traders will get it wrong. In this live webinar, I break down how to read supply and demand imbalances across multiple timeframes. In this session, I analyze key Forex pairs, including: Most traders focus on indicators, news, or short-term moves. That’s exactly why they...

Don’t Buy Google Stock Until You See This ($191 Target)
When analyzing Alphabet Inc. (GOOGL), most traders get distracted by short-term movements, news headlines, and opinions about the company. However, price does not move because of opinions, earnings reports, or what analysts say on financial media. Price moves because of imbalances between buyers and sellers, and those imbalances are best identified on higher timeframes. If...
The Illusion That War Moves Oil Prices
Every time there is a geopolitical conflict, the same narrative repeats itself. The news starts shouting that oil prices are rising because of war, supply disruptions, or political instability. Traders jump into charts already biased, convinced that price must go higher simply because the situation feels tense. But when I step back and look at...


Everyone Is Wrong About Coca-Cola Stocks
June 30, 2026


