Strength of the Impulse
Learn to assess bullish and bearish impulses by reading the sequence, size and behaviour of their candlesticks.
PUMP & DUMP · UNSUSTAINABLE MOVES COURSE
Most traders buy after a huge rally and sell after a brutal drop. I’ll show you how the strength and duration of a move can warn you when price may be stretched — especially on higher timeframes. The same principles apply to smaller intraday charts too.
6 hours of video · 130+ assets analysed · Lifetime access
WHY TRADERS GET CAUGHT
A strong rally doesn’t automatically mean you should buy.
A violent sell-off doesn’t automatically mean you should sell.
What matters is the strength, speed and location of the whole move.
The market doesn’t hand out medals for arriving late.
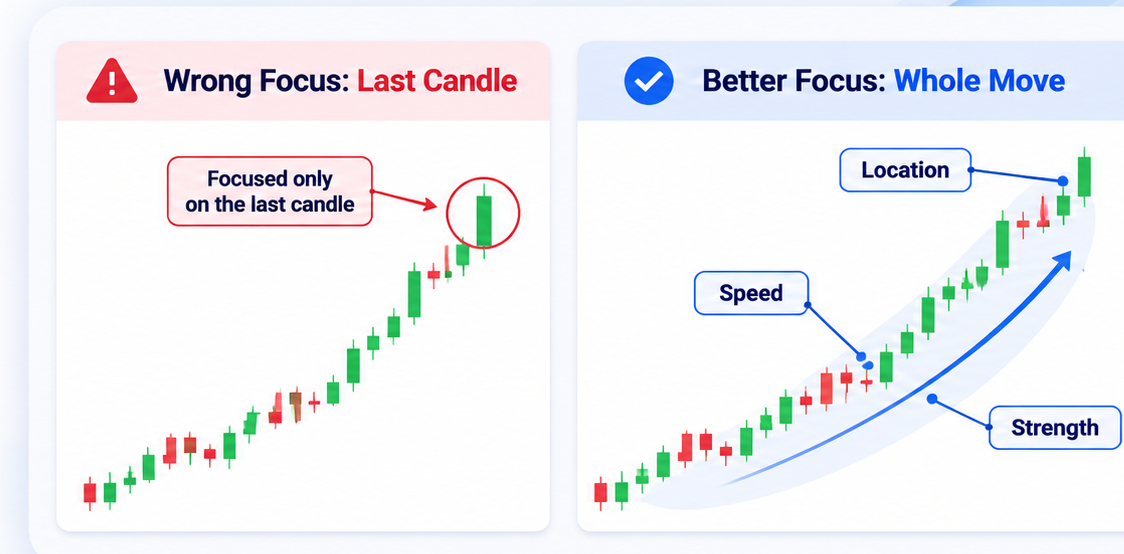
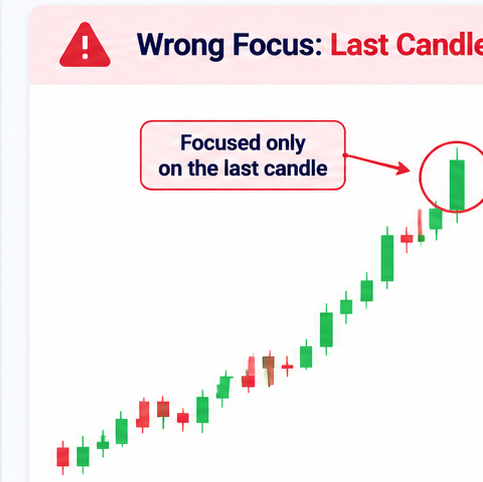
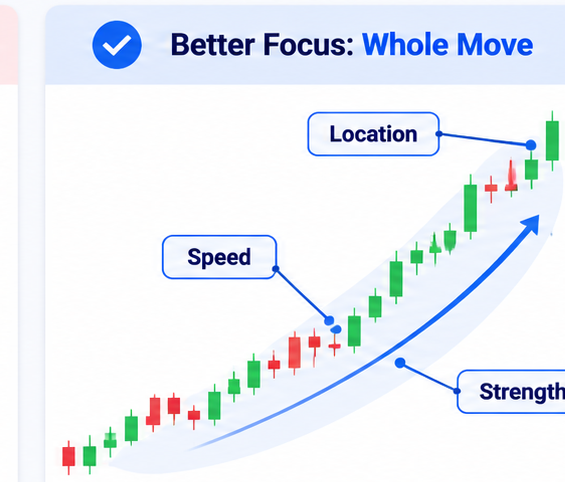
READ THE MOVE, NOT THE EXCITEMENT
Learn to assess bullish and bearish impulses by reading the sequence, size and behaviour of their candlesticks.
Understand why the number of candles and the time taken to complete a move can help you judge whether it may be sustainable.
Use weekly, monthly and quarterly charts to assess moves with greater structural significance and put potential exhaustion into context.
Apply the same price-action principles to intraday charts. The logic is the same; the noise and importance of higher-timeframe context are not.
Unsustainable moves are especially significant on weekly, monthly and quarterly charts. But price is fractal. You can spot similar impulses on 5-minute, 15-minute and hourly charts too. The timeframe changes; the principle doesn’t. Just remember: smaller charts produce more noise, so context matters even more.
LET THE CHARTS DO THE TALKING
One trader buys after a powerful rally. Another sells after a violent decline. Different directions, same mistake: ignoring the strength, duration and location of the move.
THE PUMP
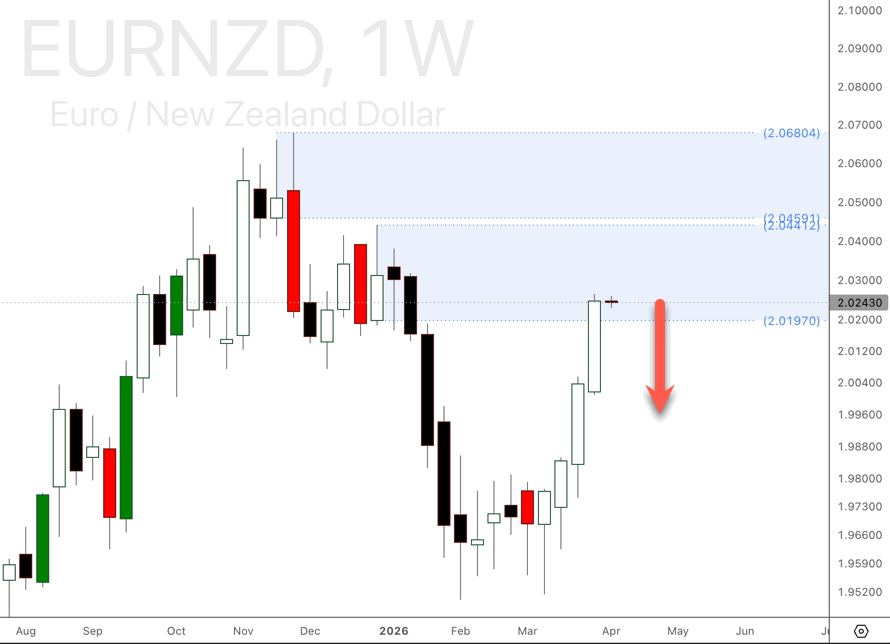
EURNZD · Weekly
Buying after a strong rally with weekly supply in control ignores the bigger picture. Selling after the earlier sharp decline would also have meant chasing the move. You won’t see this weekly context by looking only at smaller timeframes.
THE DUMP
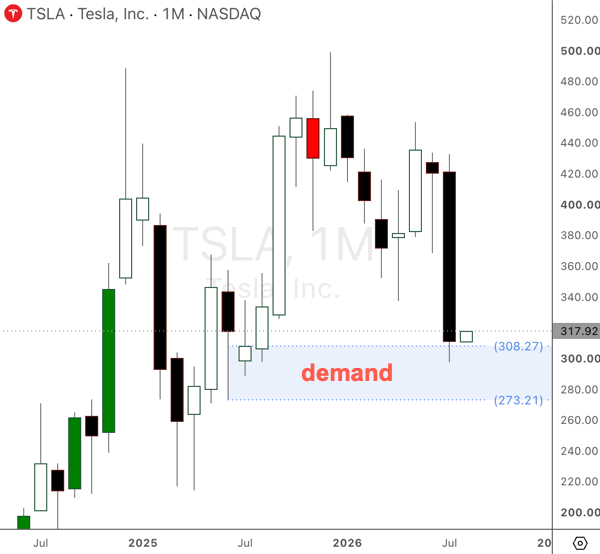
Tesla (TSLA) · Monthly
Tesla’s strong monthly sell-off reaches a marked monthly demand zone. Selling simply because price has fallen ignores that higher-timeframe location. The monthly chart provides context that a smaller chart alone cannot.
INSIDE THE COURSE
I’ve kept this course focused on understanding unsustainable moves and recognising them on actual charts. The recorded analysis covers more than 130 assets, including stocks, Forex, cryptocurrencies, ETFs, futures and commodities.
MODULE 01
Learn to identify pumps and dumps, assess impulse strength, consider time and understand why higher-timeframe context makes such a difference.
MODULE 02
Study bullish and bearish extremes across different markets, with attention to how the principles apply to both longer-term and smaller intraday charts.
No magic indicator required. The candlesticks are already doing plenty of talking.
CHOOSE YOUR COURSE
Unsustainable Moves focuses on one particular part of price action.
If you also want the complete supply and demand foundation, the All Courses Bundle includes this course and the Core Principles methodology.
Prices exclude taxes.
COMMON QUESTIONS
Does this apply to smaller timeframes? +
Yes. The same concepts can be applied to intraday charts, including 5-minute, 15-minute and hourly timeframes. Unsustainable moves are generally more significant on larger timeframes, so I put particular emphasis on weekly, monthly and quarterly charts. Smaller charts also need more context because they are noisier.
Will every sharp rally or sell-off reverse? +
Of course not. A strong move isn’t automatically unsustainable. You’ll learn to judge its strength, duration and location so you can recognise potential exhaustion without assuming that every impulse will reverse.
Do I need to know supply and demand already? +
Basic familiarity with candlesticks and market structure helps. If you’re new to supply and demand, I recommend starting with my Core Principles course or choosing the All Courses Bundle.
Learn to recognise when a powerful move may be losing strength before you decide to follow it.
Buy Course