03 Nov

Everybody’s been hyping up Meta lately… but while the crowd was buying, I was waiting. Why? Because the charts were screaming supply in control. And guess who else was selling? Mark Zuckerberg himself — millions of dollars every single day. Today, I’ll show you how supply and demand predicted this massive drop in Meta’s stock weeks before it happened.
Meta Platforms — yes, Facebook — just gave us a masterclass on why supply and demand always win over hype, headlines, or earnings reports. While most traders were celebrating new highs in the middle of 2025, the monthly timeframe was quietly flashing danger signs.
The Bigger Picture: Monthly Timeframe
In Meta’s video analysis below, you can clearly see the monthly demand imbalance highlighted in blue, sitting down around $592–$480.
That’s the zone where institutions will most likely start accumulating again.
Now, look at what happened before the drop. From May to July 2025, Meta rallied strongly. But then, look at August and September — the candlestick bodies shrank. That’s the classic profit-taking signal. The rally had lost strength, and the imbalance above price — the weekly supply zone — had taken control. Price action and supply and demand are everything we need to trade stocks.
Emotionally, this is where most retail traders start thinking, “Maybe it’ll break higher this time.”
But the institutions? They were already unloading. And how do we know that?
Because supply was in control, and insider selling confirmed it.
Meta’s Weekly Confirmation
Now let’s zoom in on the weekly chart.
A perfect weekly supply zone formed at $757–$790 (3), exactly where the monthly supply was sitting.
And as soon as price touched that zone — boom — Meta tanked.
But the story doesn’t stop there.
On October 29th, 2025, Meta released its earnings (4).
And while revenue slightly beat expectations, earnings per share missed by a mile:
- Estimated: 6.723
- Reported: 1.05
- That’s a shocking –84% surprise in EPS.
The result? Meta’s stock collapsed more than 13%, wiping out $100 per share in a single session. Who knew this date before it was released? I will let you guess it 🙂
Now, did that happen because of the earnings? No. It happened because the weekly supply and monthly context were already bearish. The fundamentals only confirmed what the chart had already shown.
Meta Platforms Insider Trading – The Final Clue
This is where it gets really interesting.
Between August 1st and August 18th, 2025, Mark Zuckerberg — Meta’s CEO — sold over 15,000 shares per day, cashing out more than $12 million daily.
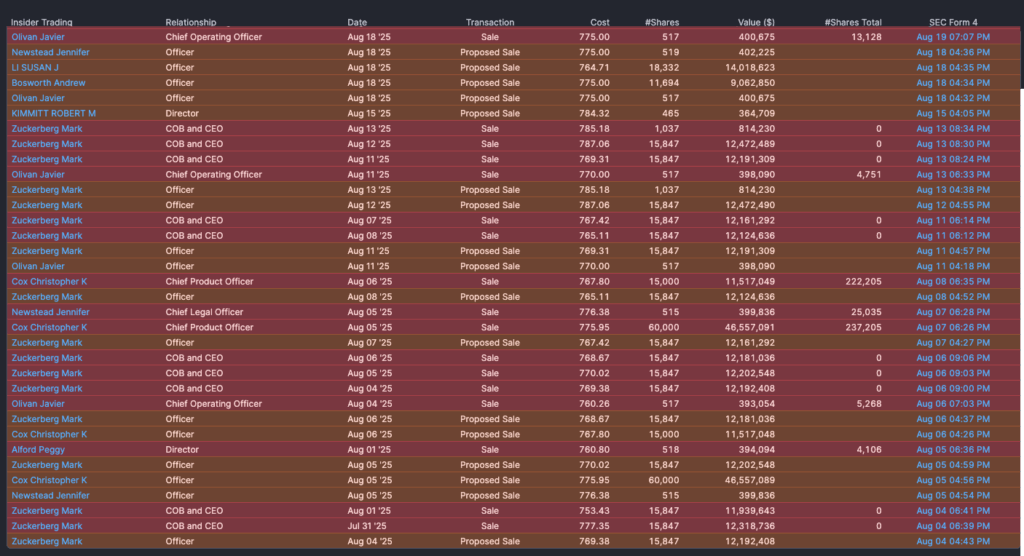
That’s not just a “coincidence.” That’s timing. When the CEO of a company sells continuously at all-time highs, and the monthly chart is showing weakness and showing weekly supply in control, you don’t need an MBA to know what’s coming next.
This was a textbook-orchestrated scenario:
- Monthly supply in control ✅
- Weekly supply confirming ✅
- Earnings surprise accelerating the fall ✅
- Insider selling sealing the deal ✅
Everything aligned perfectly for a drop toward the $592 monthly demand imbalance.
And remember, that’s not a “support level.”
That’s a pocket of unfilled institutional buy orders.
That’s where real demand lies.
Stock Trading Lesson Learnt
Trading is not about guessing.
It’s about waiting — patiently.
While the crowd was euphoric, those of us reading price action were already planning for this drop.
So next time the crowd screams “to the moon,” zoom out to the monthly timeframe and ask yourself:
“Is supply or demand in control?”
Because price doesn’t move because of headlines — it moves because of imbalances.
And Meta Platforms just gave us the perfect reminder.
Summary
Meta Platforms ($META)
- Monthly demand: $592–$480 (target zone)
- Weekly supply: $757–$790 (in control)
- Weekly supply: confirmed rejection
- Earnings: -84% surprise on EPS
- CEO Insider Selling: +150k shares offloaded during peak prices
All signals point in the same direction: down to monthly demand. So I’ll keep doing what I always do — set and forget — waiting patiently for price to return to that monthly demand imbalance before even thinking of new longs.


Forex Isn’t Random! Why Forex Prices Really Move
October 29, 2026

