A Pattern Without Location
A beautiful bullish engulfing candle means little if price is rallying straight into a strong weekly or monthly supply imbalance.
PRICE ACTION TRADING COURSE
A candlestick pattern means very little without the right context and location.
I’ll teach you to understand price action, market structure and higher-timeframe imbalances before making trading decisions.
6 modules · 31 listed lessons · 6+ hours of video

They memorise dozens of candlestick patterns but ignore where those patterns form, what the bigger timeframes are doing, and which supply and demand imbalances control price. Then they wonder why the textbook setups keep failing.
A beautiful bullish engulfing candle means little if price is rallying straight into a strong weekly or monthly supply imbalance.
A bullish reversal on H1 can be nothing more than a small pullback inside a powerful daily downtrend.
Traders concentrate on a handful of candles while missing the supply and demand areas that may control the next major move.
A long wick, doji or shooting star shows behaviour at a particular moment. It doesn’t automatically mean the market is about to reverse.
You don’t need another collection of Japanese candlestick names. You need to understand what those candles are telling you, where they’re forming, and whether the bigger picture supports the trade.
Learn to interpret candle bodies, wicks, momentum, rejection, indecision and engulfing formations as evidence of buyer and seller behaviour.
Understand why a reversal pattern at higher-timeframe supply or demand deserves a different interpretation from the same formation in the middle of nowhere.
Learn how the dominant trend, higher-timeframe imbalances and current market conditions affect what a candlestick formation may mean.
Recognise impulses, corrections, changes in momentum and market structure instead of interpreting every candle in isolation.
Learn why a pattern on H1, D1 or the weekly chart carries a different significance, and how to analyse it in relation to the larger market.
Study hammers, shooting stars, engulfing formations, dojis and other patterns without treating them as automatic buy or sell signals.
Bullish price action means different things depending on where it forms. On the GBPUSD monthly chart, two bullish engulfing patterns appear with monthly demand in control. On the EURUSD weekly chart, new bullish price action moves straight into strong weekly supply. The candles alone don’t tell you which side of the market deserves attention.
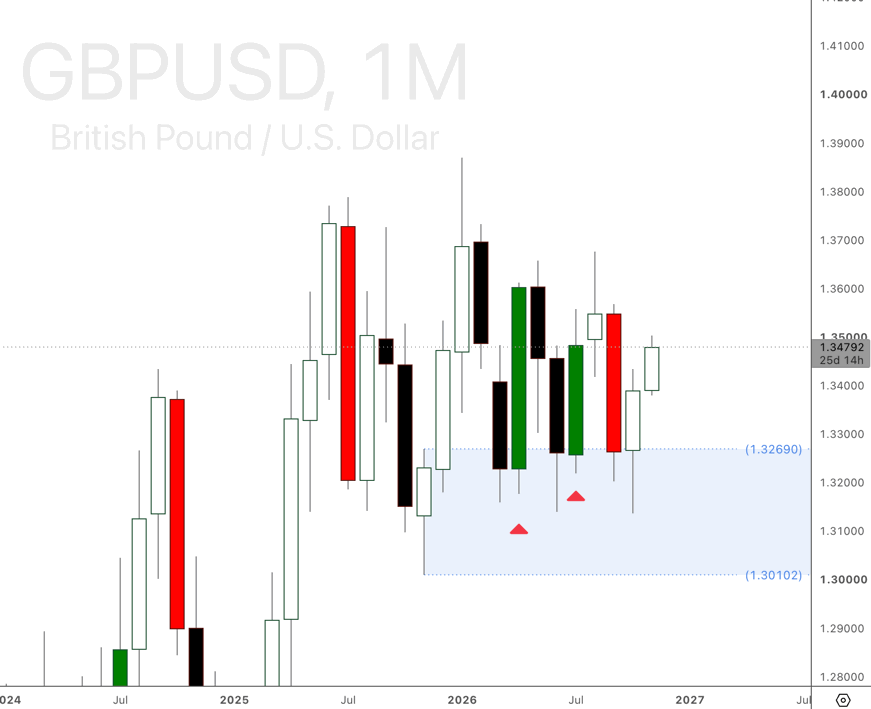
GBPUSD · Monthly chart · Two bullish engulfing patterns with monthly demand in control.
On this GBPUSD monthly chart, the two arrows highlight bullish engulfing patterns while monthly demand is in control. Their location gives the bullish behaviour meaning.
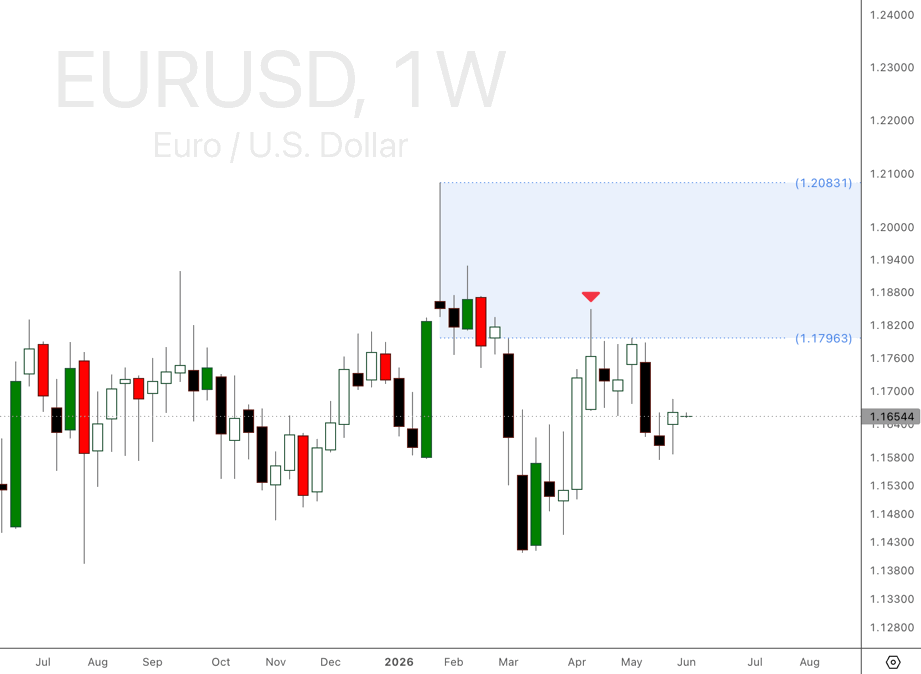
EURUSD · Weekly chart · Bullish price action into strong weekly supply is not a buy signal.
On this EURUSD weekly chart, new bullish price action rallies directly into a strong weekly supply imbalance. That bullish movement is not a buy signal—it brings price into an area where selling pressure can take control.
Before interpreting a reversal pattern, understand which higher-timeframe imbalances are relevant, where price is located, and how the smaller timeframe fits into the larger structure.
Identify the major market context and the important supply and demand areas that could influence price.
Determine where price sits relative to those areas, how the market has moved into them, and what the current trend and momentum suggest.
Look for meaningful rejection, engulfing, indecision or momentum changes. The same pattern may deserve different treatment in different locations.
Consider whether the formation supports or conflicts with the higher-timeframe picture, and whether it suggests a limited reaction or a potentially more significant movement.
A framework for interpreting price action. The complete Supply and Demand Core Principles entry rules and trade-planning methodology are taught separately.
Six modules take you from reading individual candles to interpreting their meaning within market structure, location and the larger timeframe context. Explore all lessons in the course curriculum.
Why prices move, what candlesticks represent, why price is fractal, and why traders misread the larger market.
Candlestick anatomy, bodies, shadows, rejection, momentum, and the psychology behind price behaviour.
How trends, impulses, pullbacks and dominant timeframes influence the interpretation of price.
Higher-timeframe supply and demand, fresh imbalances, meaningful rejection, and the importance of where patterns form.
Hammers, shooting stars, dojis, engulfing patterns, morning and evening stars, and other formations interpreted in context.
Bring location, momentum, trend, structure and candlestick behaviour together through Forex and stock examples.
You recognise plenty of candlestick formations, but still struggle to understand which ones deserve attention.
You make decisions using one chart without considering higher-timeframe structure or stronger imbalances.
Your setups look convincing, yet reversals repeatedly fail or price moves against your expectations.
You want to read the behaviour behind the candles instead of depending on indicators or isolated pattern signals.
This course focuses on understanding and interpreting price action. If you’re looking for my complete supply and demand trading rules and trade-planning methodology, start with the Supply and Demand Core Principles Course.
Learn how to interpret candlestick behaviour within the larger market picture.
Context, location & market structure
30 listed lessons · more than 6 hours of recorded training. Lifetime access, at your own pace.
Standalone education course. Personal coaching, ongoing market analysis and trade ideas are separate services.
Is this course suitable for beginners? +
Yes, particularly if you want to understand how candlesticks, market structure and price behaviour work together. If you want to learn my complete supply and demand trading methodology and its rules, I recommend starting with the Core Principles Course.
Does the course teach candlestick patterns? +
Yes. I cover hammers, shooting stars, engulfing patterns, dojis, morning and evening stars, and other formations. But I teach you how to interpret them within the market context rather than treating them as automatic trading signals.
Can I apply this knowledge to different markets and timeframes? +
Yes. Price action, candlestick behaviour and market structure can be studied across Forex, stocks, cryptocurrencies, indices and other financial markets. Their significance depends on the market context and the timeframes you’re analysing.
Is this the same as the Supply and Demand Core Principles Course? +
No. The Price Action Course focuses on reading candlesticks, understanding structure and interpreting behaviour through context and location. The Core Principles Course teaches my complete rule-based supply and demand methodology.
Does the course include personal support or trade ideas? +
No. This is a standalone educational course. Personal coaching, feedback and access to ongoing trading ideas are separate services.
The market doesn’t care whether you call a candle a hammer, a shooting star or a dragonfly doji. What matters is where it forms, what the bigger timeframes are doing, and what price is actually telling you.
Get the Course