
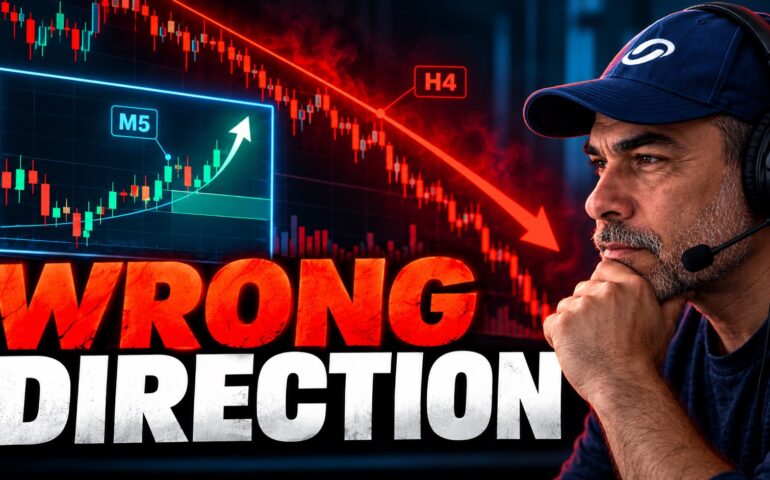
Why Your Best Trading Setups Keep Failing: The Multi-Timeframe Context Solution
Every trader reaches a point in their career where they identify what appears to be a flawless entry setup—a pristine supply or demand zone, clean price action, and perfectly aligned technical indicators- only for the market to immediately roll over and stop them out. When high-probability setups consistently fail, the issue is rarely the entry...

The Timeframe Trap in Trading: How Multi-Timeframe Supply & Demand Cures Overtrading
In modern financial markets, the biggest threat to a trader’s capital isn’t a lack of technical indicators—it’s the Timeframe Trap. Traders frequently drop down to 1-minute, 5-minute, or 15-minute charts searching for lower-risk entries, only to get chopped up by market noise, spread friction, and high-frequency volatility. Without a high-timeframe bias to guide directional bias,...

Support & Resistance vs. Supply & Demand: Why You Are Trading Wrong
Let’s get one thing straight before you get your feelings hurt: draw all the horizontal lines, trend channels, and rainbow-colored Fibonacci retracements you want on your trading charts. The market doesn’t care. The institutional order flow driving trillions of dollars a day doesn’t know your line exists, and it certainly isn’t respecting that arbitrary price...

Most Forex Traders Are Blind to the US Dollar: A Masterclass in Market Delusion
If you spent this morning squinting at a 5-minute chart, convinced that your “Double Bottom” pattern on EUR/USD was about to fund your dream lifestyle, allow me to break the news gently: you are trading on hopium. The retail trading world is plagued by a chronic inability to see the forest for the trees. Traders...

The Oil Game: Why Intraday Traders Get Liquidated While Big Capital Swings Higher Timeframes
Every time geopolitical tensions flare—whether in the Strait of Hormuz, the Middle East, or Eastern Europe—the media machine cranks up its narrative engine. News outlets broadcast sensational headlines about OPEC production quotas, potential supply chain collapses, and sudden inventory draws. Retail day traders rush to their screens, glued to 5-minute charts, MACD indicators, and news...

Why You’re Trading the Wrong Timeframe (And Why You’re Still Broke)
Let’s skip the polite lies retail trading gurus feed you every day. If you are staring at a 1-minute, 5-minute, or 15-minute chart right now, stressing over every micro-tick, drawing rainbow indicators, and wondering why your stop-loss gets hit every time you buy a “breakout”—I have simple news for you: You are trading the wrong...

Your Trading Timeframe Is Your Biggest Problem: Why Retail Day Traders Fail
Have you ever opened a position on a 5-minute or 15-minute chart, watched it move immediately into profit, only to have the market violently reverse and hit your stop loss? You aren’t a bad trader. You are simply trading the wrong timeframe. Most retail market participants fail because they are trapped in lower-timeframe market noise....

The Real Reason Why Forex Markets Move: Debunking the News Myth
Most retail traders enter the currency markets with a fundamental misunderstanding of what actually drives price action. They spend hours glued to CNBC, financial newsletters, and economic calendars, attempting to trade forex by predicting central bank interest rates, GDP releases, or geopolitical tensions. However, relying on the daily news cycle to find high-probability setups is...

Why Everyone Is Wrong About Earnings: A Supply and Demand Reality Check
For generations, retail stock traders have been conditioned to follow a specific script when earnings season rolls around. The routine is always the same: you pull up the economic calendar, analyze consensus estimates, obsess over EPS (Earnings Per Share) forecasts, track revenue growth, and wait for management guidance with fingers crossed. The underlying assumption is...

Popular Indicators Are a Lie
Let’s be honest for a second. If drawing a couple of colourful lines on your chart and waiting for two moving averages to cross like a pair of clumsy star-crossed lovers actually worked, every single person with an internet connection would be sipping champagne on a superyacht in Puerto Banús (Marbella city, where I live)...


Support & Resistance vs. Supply & Demand: Why You Are Trading Wrong
September 25, 2026
Tesla Optimus Robot: The Doom of Humanity or Your Next Big Win?
September 18, 2026
