14 Aug 2024
Microsoft Stock (NASDAQ: MSFT) Price Action Analysis: when to expect a bullish leg. As whispers of a bear market in August 2024 grow louder, savvy investors seek the perfect entry point to maximize their returns. Among tech giants, Microsoft stands out for its robust fundamentals and intriguing price action patterns that can guide your stock trading strategy. In this price action stock analysis blog post, I will analyse Microsoft’s price movements and unveil critical price action insights that could help you time your entry just right. Whether you’re a seasoned trader or just starting out in the investment game, understanding these nuances will empower you to navigate the upcoming market shifts confidently.
Introduction to Microsoft Stock and Price Action Analysis
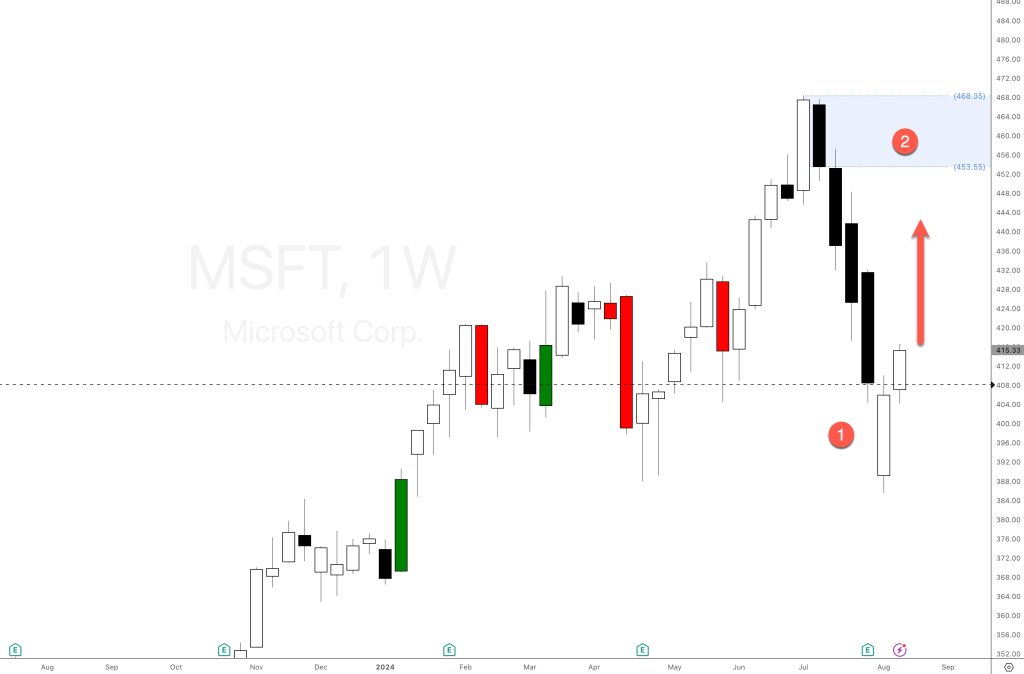
The weekly chart for Microsoft stock (NASDAQ: MSFT) indicates bullishness following a significant decline that began in July 2024. In this situation, strategies based on price action should discourage selling, as we can anticipate a bullish correction after such a steep bearish trend. This is a simple rule, as demonstrated.
The weekly timeframe for Microsoft’s stock reveals a new supply imbalance at $450 per share and three significant bearish candlesticks from July 2024. When this type of bearish price movement occurs, we should consider selling the stock because a new bullish trend is anticipated, as evidenced by the formation of the last two large bullish candlesticks.
Microsoft stock has long been a favourite among investors, and it is known for its resilience and growth potential. As we approach what many analysts predict to be a bullish phase in the market, understanding price action is crucial for making informed decisions about when to buy. Price action analysis allows traders to read the market’s movements, grasp trends, and identify entries.
Understanding Bullish and Bearish Stock Markets
Bullish and bearish markets represent the ebb and flow of investor sentiment. A bullish market signals optimism, where prices are rising or expected to rise. Investors feel confident, leading to increased buying activity. In contrast, a bearish market indicates pessimism. Prices fall or are anticipated to decline. Fear prevails among investors, resulting in selling pressure that can further drive prices down.
Understanding these market conditions and the strength of the candlesticks is essential for making informed decisions. Bullish trends often attract more attention from traders looking for opportunities to profit quickly. Meanwhile, bear markets might present challenges but also offer chances for value investing as stocks may be undervalued.
Recognizing the signs of each phase can help you navigate investment strategies effectively, as I’ve explained above, referring to Microsoft’s weekly timeframe. Keeping an eye on economic indicators and corporate performance provides crucial insights into the market’s direction.
Related Post


Alibaba Stock: Stop Gambling on Earnings Reports!
May 25, 2026
Charts Don’t Lie, But Wrong Timeframes Do
May 20, 2026